Alaskan River Ice Phenology
National Park Service biologists were interested in studying how river ice phenology impacts Caribou migration patterns in Northwestern Alaska. My NASA team used Landsat and Sentinel imagery to generate time series map animations illustrating the timing of ice formation at three river crossing zones. Because of the correlation between VV/VH backscatter and ice cover, we also visualized the transition from open water to solid ice through radar imagery time series plots.
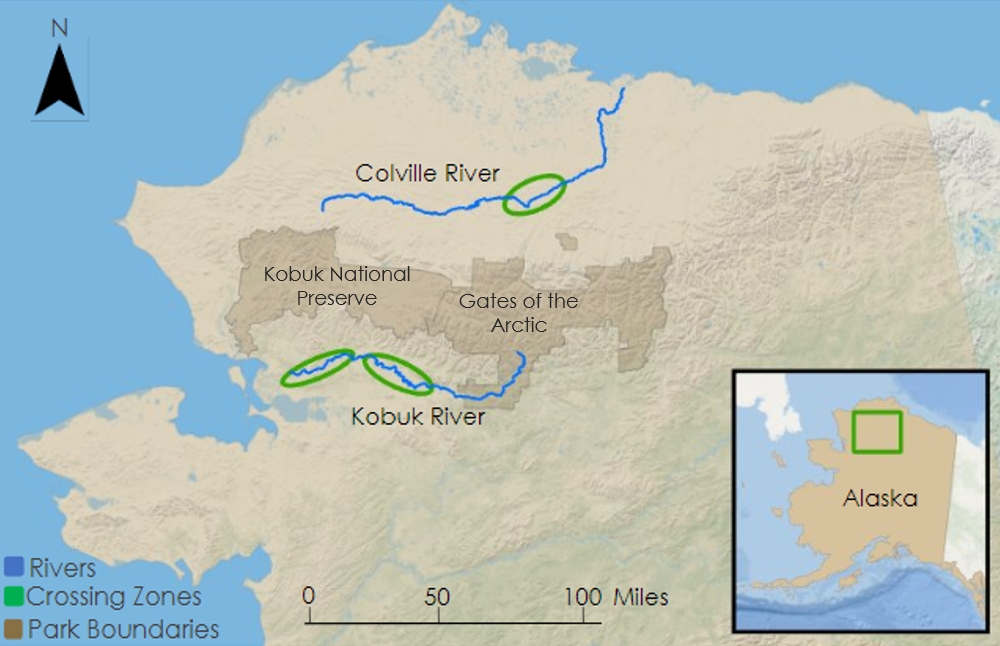
Project study map
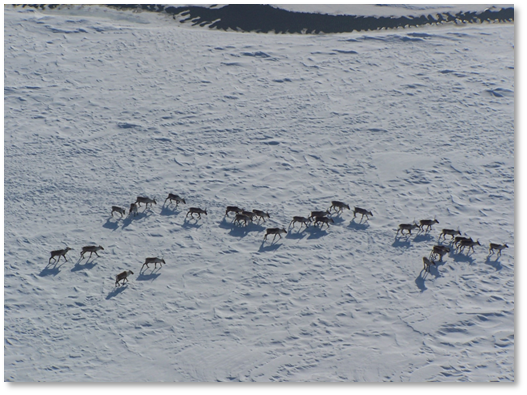
Caribou crossing the Colville River after ice formation (Photo Credit: Dr. Kyle Joly, NPS)
2020 ice formation timeline from radar image analysis (10 km West Kobuk River site)
Approximate annual ice formation date from radar image analysis (8 km West Kobuk River site)
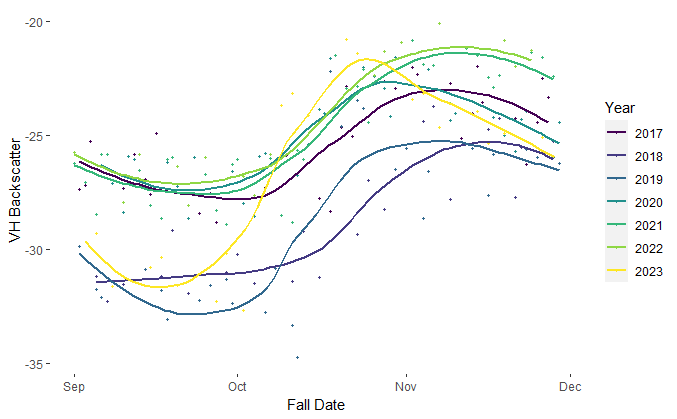
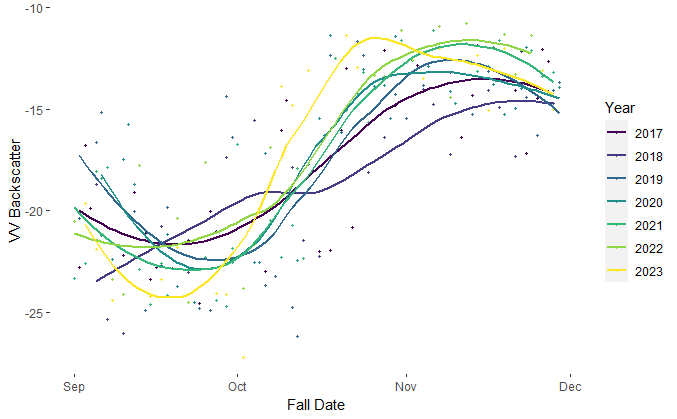
West Kobuk annual fall ice formation VH (left) and VV (right) backscatter time series plots with spline interpolations

