Yankton Sioux Water Quality Project
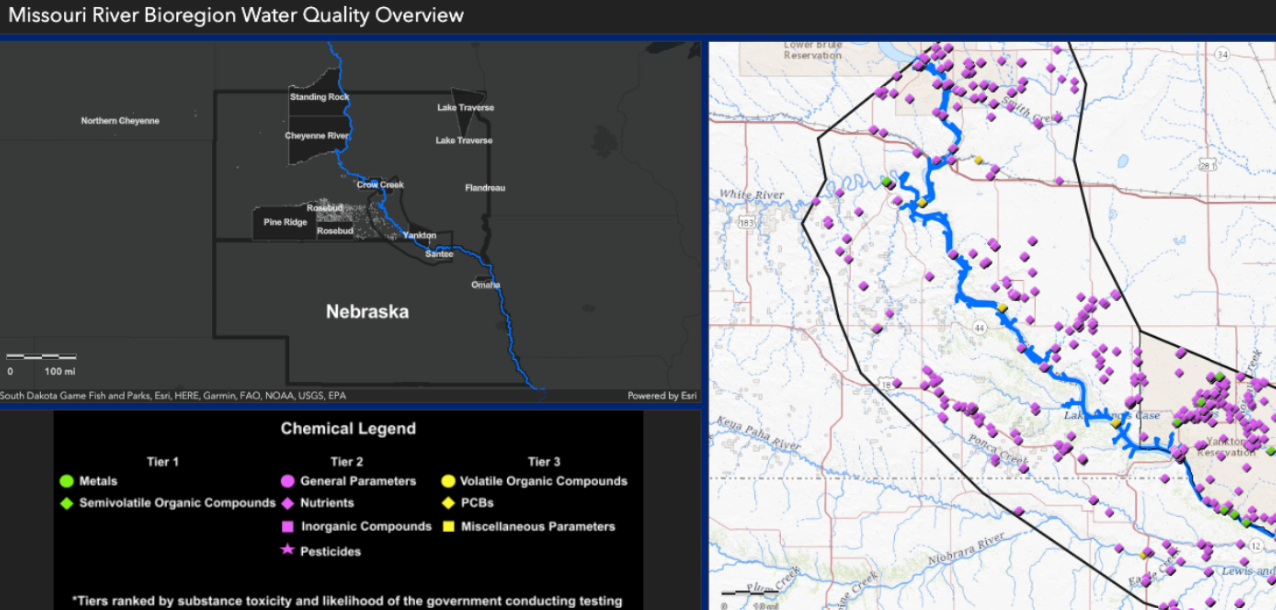
Two students and I designed an interactive dashboard and story map assessing Missouri River water quality
along the Yankton Sioux reservation. This resulted from concerns regarding water quality in Indigenous
residential areas. Users can click on sampling locations on the dashboard to view specific chemicals and
their measured toxicity levels. The supplemental story map explains the context behind the project and
its broader environmental implications.
The Yankton Sioux have protocols preventing collaborators
from publicly sharing work, so I can only share screenshots of the work. For more information, please
contact Dr. Joseph Robertson, project coordinator and chief data scientist of Mato Ohitika Analytics LLC, at
jrobertson@bravebearanalytics.com.